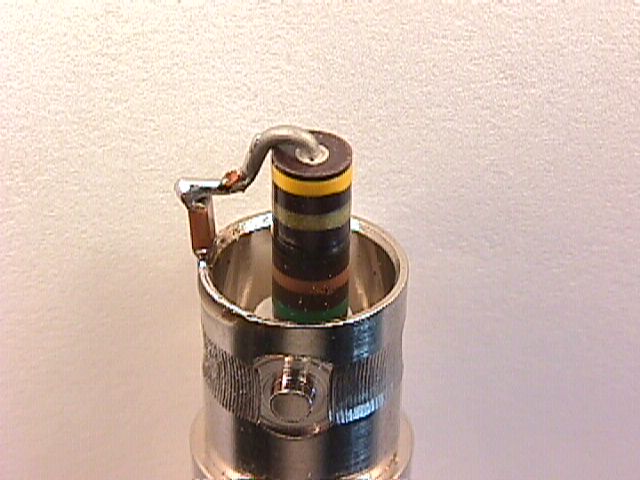
Figure 1. Test Circuit for Measurement of Capacitor Self-inductance and ESR

Address: P. O. Box 1457, Los Gatos,
CA 95031
TEL:
800-323-3956/408-356-4186
FAX:
408-358-3799
Mobile: 408-858-4528
URL:
www.dsmith.org
Email: doug@dsmith.org
Figure 1. Test Circuit for Measurement of Capacitor Self-inductance and ESR
Technical Background
The parasitic parameters of a capacitor, that is its equivalent series resistance (ESR) and its inductance, affect the way the capacitor performs in circuits. Some applications are very sensitive to these parameters. For instance, a bypass capacitor used between power and ground in a digital circuit must be able to supply current quickly to nearby active devices. If it has too much inductance it will not be able to do this. Similarly, the transient response of a capacitor used to divert a current pulse due to electrostatic discharge is very important to the ability of the capacitor to do its job.
So how can the parasitic parameters of a capacitor be measured? One could certainly connect the capacitor to a network analyzer and get a very good characterization. Such an instrument can be quite expensive though. Even the less expensive capacitance measuring instruments may not be available when needed. Both instruments may not provide the information in an easily usable form. If you have a pulse generator (preferably with a 50 Ohm output impedance) and an oscilloscope, you can easily measure the transient response of a capacitor. From this data the capacitor's ESR and inductance can be determined.
First, construct the simple network shown in Figure 1 at the end of a 50 Ohm coaxial cable fed from a 50 Ohm pulse generator. A 50 Ohm resistor is used in Figure 1 to terminate the coax during the rising edge and provide a total of 100 Ohms of source impedance. The resistor shown is a 51 Ohm 1/2 watt carbon composition resistor with one lead trimmed so that the resistor just seats with the trimmed lead fully inserted into the BNC connector. It may be necessary to put a little solder bump on the resistor lead so that it stays firmly in the BNC connector. The capacitor to be tested is connected between the end of the resistor and the shell of the BNC connector. An oscilloscope is connected directly across the capacitor using leads as short as possible to connect the probe. Probes with a resistive input impedance of 500 to 1000 Ohms are recommended. Standard 10X "Hi-Z" probes often have rising edge effects that will distort the part of the waveform used for the calculations.
For a pulse length that is long with respect to the RC time constant,
one will see an exponential rise to the open circuit voltage of the pulse
source. For the purposes of this discussion, we will be looking at the
first couple of hundred millivolts of a 5 volt exponential rise. An example
of this appears in Figure 2.
Figure 2. Initial Rise
Figure 2 shows the beginning of the exponential voltage rise across the capacitor when the generator pulse starts. The vertical scale is about 200 mV and the horizontal time is a small fraction of the RC time constant of 100 Ohms and the capacitor being measured. Since the capacitor voltage is still very small compared to the 5 Volt open circuit output of the generator, the current through the capacitor may be presumed to be constant and equal to the generator open circuit voltage divided by 100 Ohms, 50 mA in this case.
The risetime of the current will be the same as the generator voltage. If the rise is a ramp with a constant slope and the capacitor had no inductance, the initial rise shown in Figure 2 would follow the dotted line and then the slope would change to the initial slope of the exponential rise determined by:
1) dv/dt = i /C = 50 mA/C
where
C is the value of the capacitor at this low voltage
and the
risetime of the current << RC.
The offset between the baseline and the beginning of the exponential rise is just the voltage that the current, 50 mA for this case, develops across the ESR of the capacitor. The ESR can be easily estimated in this case by dividing the voltage offset (labeled ESR in Figure 2) by 50 mA.
Parasitic inductance in the capacitor will cause the spike in the waveform shown in Figure 2 exceeding the value of the dotted line along its length. If the current rise were in fact a ramp with constant slope and very sharp corners (high di2/dt) then the spike would be a square pulse of value:
2) E = L*di/dt
where
L is the parasitic inductance of the capacitor.
The current rise from the generator used for the data in this article was not a ramp with very sharp corners and constant slope (the case for most generators I have used). That characteristic of the generator combined with probe effects led to a peaked shape to the Ldi/dt spike as shown in Figure 2. Using equation 2 the inductance of the capacitor can be calculated. Often, one does not need to calculate the inductance or ESR but just choose a capacitor from several available ones that has the lowest inductance and/or ESR.
Soldering the components onto a BNC connector as in Figure 1, works up to 300 MHz. I estimate the inductive reactance of the loop formed by the capacitor and resistor to be about 20 Ohms at 300 MHz (estimating the inductance at 10 nH). This is small enough relative to the 100 Ohms of resistance in the circuit to not significantly affect the initial current very much. For this frequency range a generator with a risetime of one to two nanoseconds will do.
If you need to check the capacitor using faster risetimes, it would
be best to build the test setup on a small circuit board with a ground
plane and controlled impedances. At this point, the parasitic capacitance
of the 50 Ohm resistor would also be an issue to be taken into account.
Fortunately, such accuracy is often not needed. Especially, if one is just
comparing the relative performance of several capacitors.
Data
Figure 3 below shows the initial rise from the generator. The black
square indicates the vertical voltage and horizontal time scales. The open
circuit voltage was a little over 4 Volts with about a 5 nanosecond risetime.
The data in Figures 3 through 6 were taken with an analog scope some years
ago. Figures 4 through 6 show data obtained from several leaded capacitors
(as opposed to surface mount). Two traces were taken for each capacitor.
The lower trace was measured at the capacitor body where the leads entered
and the upper trace included the minimum amount of lead to practically
connect the capacitor to a printed wiring board. The upper trace would
not be needed for modern surface mount capacitors unless one wanted to
model the connection inductance from the capacitor to the point of interest
on a printed wiring board.
Figure 3. Input From Pulse Generator
Figure 4 shows data from a 4 uF electrolytic capacitor. The ESR offset
is about 50 mV yielding an estimate of the ESR of just over one Ohm. Notice
that there appears to be some oscillations on the 1/C part of the slope.
This could be scope probe resonance or a resonance in the capacitor. The
data was taken with a standard 10X Hi-Z probe, so the probe is suspect.
I have seen capacitors with pronounced oscillation from internal resonance.
If you are planning to put a large capacitor in parallel with a smaller
one, especially if they are constructed from different technologies, it
would a good idea to check out the impulse response of the combination
using this method. It is possible for the smaller capacitor to resonate
with the inductance of the larger one, causing an unexpected result.
Figure 4. 4uF Capacitor
Figure 5 shows the result for a 1 uF capacitor of the same construction
as the 4 uF capacitor tested in Figure 4. Note that the inductance is similar
to the 4 uF capacitor, but the ESR is slightly lower. Since an analog scope
was used, the waveform was repetitive and the slight slope on the left
half of the waveform was the end of the exponential fall from 5 volts.
If a single pulse on a digital scope was used, the slope to the left of
the Ldi/dt spike would be zero.
Figure 5. 1uF Capacitor
Figure 6 shows the result for a 1 uF radial ceramic capacitor (square
case). Note the low inductance and undetectable ESR. Note also that the
slope of the 1/C exponential rise is flatter indicating more capacitance
than the 1 uF capacitor of Figure 5. This may be due to the fact that the
electrolytic capacitor used for Figure 5 may have lower capacitance near
zero voltage than at its operating voltage whereas the ceramic capacitor
has a more constant capacitance with voltage. The inductance corresponding
to the lower trace is estimated to be 4.4 nH.
Figure 6. 1uF Ceramic Capacitor
It is interesting to note that a 0.1 uF ceramic capacitor in the same size package as the 1 uF of Figure 6 showed a slightly higher inductance in this test setup. I believe this was due to the fact that the smaller capacitor did not fill the package and internal lead inductance caused the effect. In this case, a 1 uF capacitor was a better choice than a 0.1 uF!
One of the advantages of this test is that the output waveform is the transient response of the capacitor. The voltages developed across the capacitor in this test are directly related to what will happen in a real circuit if the current risetime from the generator is similar to what the capacitor will see in its intended application.