A Simple Shielding Effectiveness Measurement
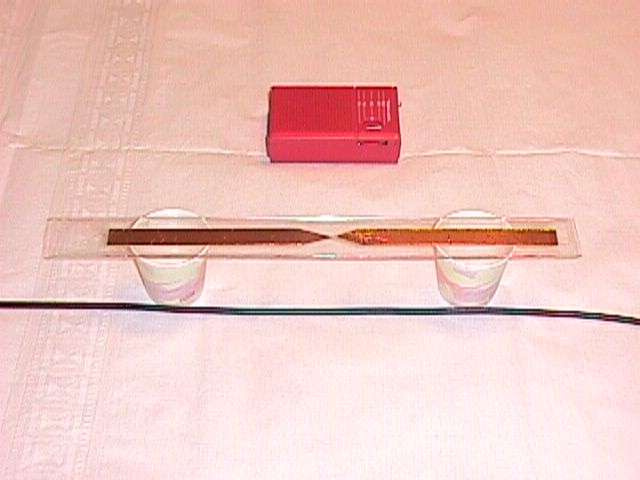
Figure 1. Shielding Effectiveness Setup Close-up

Address: P. O. Box 1457, Los Gatos,
CA 95031
TEL:
800-323-3956/408-356-4186
FAX:
408-358-3799
Mobile: 408-858-4528
URL:
www.dsmith.org
Email: doug@dsmith.org

Figure 1. Shielding Effectiveness Setup Close-up
What do the above items (an AM radio, a copper tape spark gap, two paper cups, and a cable have in common? Together they can be used as a quick way to evaluate the relative shielding effectiveness of a shielded cable. As described in the June, 2000 Technical Tidbits (A Static Field Powered EMI Source), when a static charge is brought near the copper tape on one side of the spark gap a charge is induced on the copper tape and a spark forms in the small gap between the two pieces of copper tape. A quick and easy way to do this is simply rub a styrofoam cup on just about anything and bring it near the tape on one side of the spark gap. If sparks are formed, popping sounds will be heard in the radio. The resulting electromagnetic interference, EMI, is intense. For a small spark gap like this one (it should be a fraction of a millimeter), the EMI is reasonably repeatable and relatively independent of how the static charge is generated or what its exact static voltage is. By placing the source of EMI and the cable in a fixed physical relationship with each other, the relative quality of a cable shield can be quickly determined and compared to other cables.
Figure 2 shows the complete test setup. The cable is terminated with
an enclosed 50 Ohm termination. Two small paper cups support the spark
gap several cm above the cable. If the copper tape is too close to the
cable it may become difficult to induce sparks because of the proximity
of the grounded shield to the copper tape causing partial cancellation
of the static field. Another approach would be to build a wooden test jig
to support the spark gap and cable. Such a jig would allow results from
several different tests over a period of time to be compared. The table
used in this experiment was non-conductive, wood. Results would be affected
by a conductive table. I would expect less EMI into the cable and possibly
more static charge required to jump the gap.
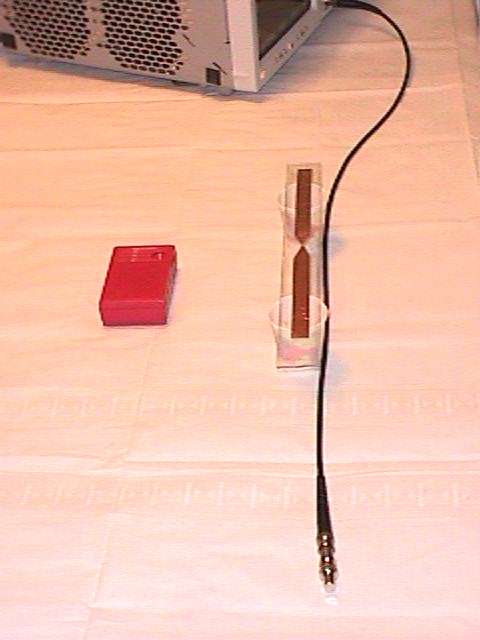
Figure 2. Shielding Effectiveness Setup Overall View
In addition to determining the relative quality of shielding, the resultant signal delivered to the scope gives an idea of how much actual interference to a signal is possible in real operation since the EMI from the spark gap is likely more intense than most, but not all, EMI one is likely to encounter in the field.. If a current probe is placed around the cable near the scope and its output also displayed, the characteristics and approximate value of the shield transfer impedance (ratio of resulting signal at the cable output to current on the shield) can be inferred. Often, by inspecting the current and voltage waveforms one can determine the relative importance of resistive and inductive effects to the shield transfer impedance. A future article will describe how to do this in detail. Another advantage of using a current probe is that one can monitor the EMI and insure that the same EMI is being applied to different cables being compared.
Figure 3 shows the voltage at the oscilloscope input as a charged styrofoam cup was brought near one side of the spark gap. Figure 4 shows the result of removing the styrofoam cup. Notice that the waveform in Figure 4 is nearly identical, but inverted with a negative going initial edge, as is usually the case. This happens because after the approaching spark occurs, one side of the gap has a net charge with respect to the other side. When the cup is removed, a spark jumps back with its current flowing in the opposite direction. Usually several sparks will jump on approach and again on removal of the static charge. If the cup is moved back and forth across the spark gap, many sparks of both polarities will be generated.
The cable used was a one meter length of good quality of RG-58/U. The
resulting 75mV of peak voltage is an acceptable level of interference relative
to most logic thresholds.
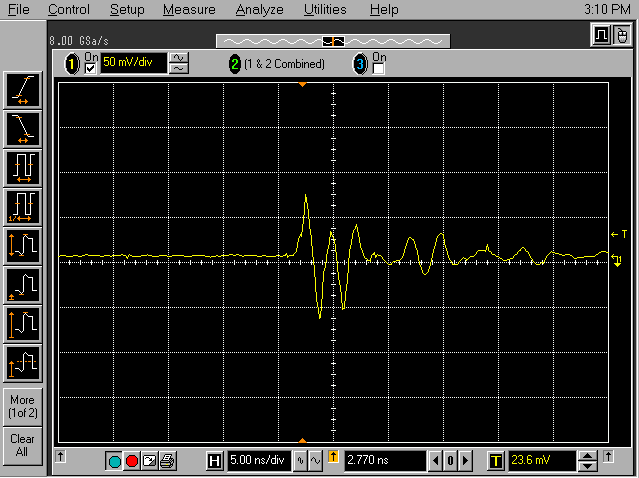
Figure 3. Signal at Scope for Cable 1 on Approach of Static
Charge
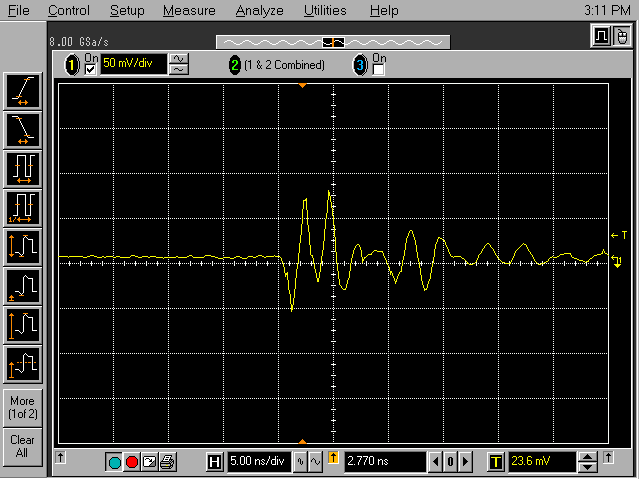
Figure 4. Signal at Scope for Cable 1 on Removal of Static Charge
Figure 5 shows the same test repeated for a two meter length of lower
quality RG-58/U. Notice that the peak level of interference is twice the
value of Figure 3 and with more oscillations present. In this case, the
interference is still acceptable for most logic families, but possibly
a problem for lower level signals. Use of a high quality cable, such as
RG142B/U would result in a signal on the order of one millivolt in this
test.
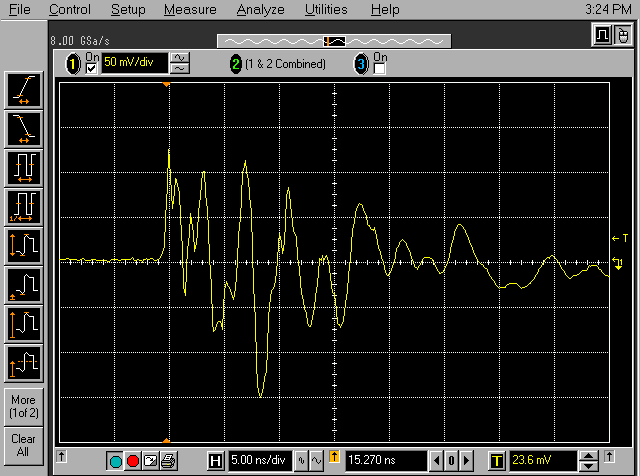
Figure 5. Signal at Scope for Cable 2 on Approach of Static
Charge
If a small pigtail is added to the shield connection at the scope as
shown in Figure 6, the voltage sensed by the scope from the EMI current
on the shield increases dramatically, usually more than an order of magnitude.
The effect is quite dramatic and I encourage you to try the experiment
in the lab. Figure 6 also shows a current probe monitoring the shield current
on the cable.
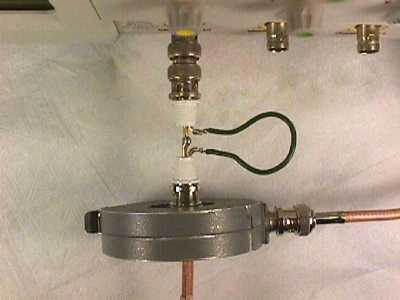
Figure 6. Addition of Pigtail to Shield Connection at Scope
Elaborate test and debug procedures are not always necessary. Often a simple test, such as this one, can yield useful information quickly when more elaborate tests are not possible either for lack of time or equipment.
All the above waveforms were taken with an Agilent Infinium 54845a oscilloscope.