 High Frequency MeasurementsWeb Page
Douglas C. Smith Address: P. O. Box 1457, Los Gatos,CA 95031
TEL: 800-323-3956/408-356-4186
FAX: 408-358-3799
Mobile: 408-858-4528
URL: www.dsmith.org
Email: doug@dsmith.org
Technical Tidbit -March 2003
Minimizing Errors in Oscilloscope Measurements
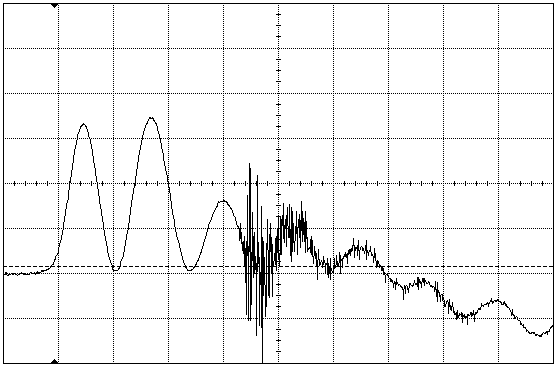
Figure 1. High Frequency Noise on a Waveform
Vertical scale = 10 Amps/div, Horizontal scale = 20 ns/div
Abstract: Digitizing oscilloscopes have become one of the mostimportant overall lab instruments over the last ten years. As useful as theyare, some interesting problems can occur that affect measurement results. Two such issuesare described. Avoiding the problems associated with these issues isstraightforward.
Discussion: Figure 1 shows a waveform taken of an ESD current on asystem cable. The interesting feature in the middle of the waveform is likely anartifact of the measurement and not really present. The cause is easy tounderstand after a little investigative work.
Many modern digitizing scopes have a minimum sensitivity of only a volt ortwo per division referenced to their input connectors, especially high performance scopes. In the example shown inFigure 1, the current being measured had a peak amplitude of over 30 Amperes.The current probe transfer impedance (Fischer F-33-1) was about 5 Ohms (voltage out dividedby current through the probe) so the probe output voltage was actually somethinglike 150 Volts! In order to keep the waveform on the screen, two 20 dB attenuatorswere used for a total attenuating factor of 100:1.
The problem lies that while the scope sees a signal of a few volts,the event being measured is quite large, resulting in the 30 Ampere current(150 Volt signal) displayed. The ESD event in this case had many times theenergy of that used for normal ESD testing, such as used for CE mark Europeantesting. Some fraction of that energy was entering the scope via a path differentfrom the signal input, possibly as a common mode current on the probe cableor as direct radiation. The result shown in Figure 1 is suspicious becausewhen the trace is expanded, the noise riding on the waveform has a di/dtof about 2000 Amp/ns or greater (current probe frequency responseis factored in). This value for di/di is much too high and reason for doubtingthe accuracy of the plot.
A problem that comes as a result of interpreting the high frequency noise as real is wastingtime trying to find it. To check for interference, use a null experimentto gauge the measurement error. A example of a null experiment is given inthe July 1999 Technical Tidbit, The Shorted Scope Probe.One possible null experiment in this case isto remove the current probe from the cable and replace it with a 50 Ohm termination.At this point the scope just has an input cable with a termination. Theresulting display should be very small compared to the actual measurement.The next step would be (for this case) to connect the current probe, foldthe current carrying wire to be measured and insert it into the current probe.This exposes the probe to the electric field on the wire, but with no netcurrent, so the result should be zero. This null experiment checks the currentprobe as well as the scope and the connection to the scope. This techniqueis detailed in "Current Probes, More Useful Than You Think," a paper on this website (click on the paper title to get the paper in pdf format).
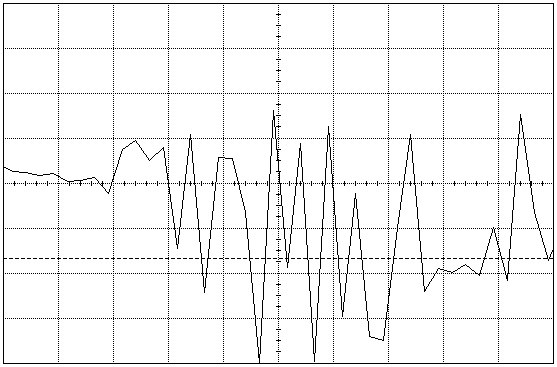
Another case of measurement error is shown in Figure 2. Normally, thedefault for many digitizing scopes is to turn on sin(x)/x interpolation. The problemis that this interpolation makes waveforms look very smooth and hides thefact that the sampling rate may be not fast enough to properly display thewaveform. In Figure 2, a high frequency waveform is displayed with sin(x)/xinterpolation turned off. One can see the straight lines connecting individualsample points. Clearly, the scope is not sampling fast enough to displaythe waveform accurately. If the sin(x)/x interpolation was on, everythingwould look fine with something close to a modulated sinewave shape.
Figure 2. High Frequency Signal Displayed with Sin(x)/x Interpolation Off
Horizontal scale = 500 ps/div
Recommendations:
- If you use an attenuator, or a probe with a high attenuation factor,on an oscilloscope to keep a waveform within the amplitude limits, checkfor interference to the scope. Placement of the scope 3 or 4 meters fromthe measurement with several ferrite cores on the scope input cable may beneeded. In extreme cases, the scope may need to be placed in a Faraday (shielded)cage.
- Turn off sin(x)/x interpolation in digital scopes for most measurements
Top of page
Home
Questions or suggestions? Contact me at doug@dsmith.orgCopyright © 2003 Douglas C. Smith


