
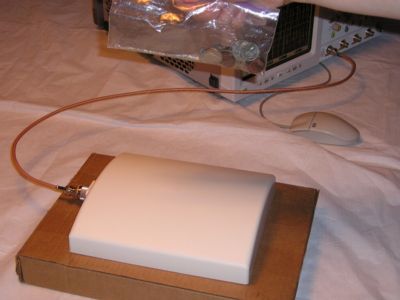
Figure 1. Test Setup With 2.4 GHz Antenna and Jingling Change
Abstract: ESD events between small pieces of metal, such as coins, at low voltages produce intense EMI with bandwidths into the tens of gigahertz. Response of a commercial Wi-Fi (802.11b) antenna to such EMI is measured. The results provide insight into one kind of noise Wi-Fi receivers are subjectedto. The results also suggest that such antennas might be used for ESD eventlocation.
Discussion: ESD between small pieces of metal can produce strong electromagneticinterference and such events are common in the work environment. Measurementsof the output of a wireless LAN antenna in the vicinity of small metal ESD show that the amount of voltage deliveredto a receiver can be significant.
Figure 1 shows a commercial antenna used in wireless LANs. About 30cm (one foot) above the antenna, a plastic bag with coins can be seen. Whenthe bag is shaken, the electromagnetic fields from the small ESD events betweenthe coins result in significant voltage at the antenna output. The antennaused for this experiment has a gain of 10 dBi (10 dB above an isotropic radiatorand about 7 dB above a dipole, see the article on LAN transmit power linkedat the end of this technical tidbit for more information on what this means).There is also an article linked on patch antennas, of which this antennais an example. The net result is that this antenna, in the direction of itsmaximum radiation, increases a received or transmitted signal by about 4times (~6 dB) the power compared to a dipole.
Figure 2. Antenna Output from Test Setup of Figure 1
Figure 2 shows a typical output from theantenna and test setup of Figure 1. The waveform in Figure 2 exceeds the range of the scope and is "off the scale"at more than 4 Volts! Note that one Volt per division is the least sensitive range of the scope. Figure 3 shows the waveform expanded out to 2 ns/divfrom the 10ns/div used in Figure 2.
Figure 3. Trace of Figure 2 Expanded at 2 ns/div
In the first 5 ns of Figure 3 there is a very sharp peak exceeding 4 volts.The oscillations preceding it are between 3 and 4 GHz, well past the1.5 GHz bandwidth of the scope, and reflecting the high bandwidth of lowvoltage ESD. It is likely that that first peak is greater than 10 Volts inreality. Just to the left of the center of the screen, a series ofpeaks occur with a frequency of about 1.5 GHz and with amplitudes well over4 Volts. Judging by the appearance of the peaks and the 1.5 GHz frequency response of the scope, I would estimate the peaks are nearly 10 Volts.
If the waveform of Figure 3 were further expanded, the plot would look jaggedbecause some parts of the waveform are very fast and require a sampling rate wellabove the 8 GSa/sec of the scope used here in order to accurately displaythe waveform. Sin(x)/x interpolation is turned off for these measurements.
With peak voltages on the order of 10 Volts (substantiallylarger than the transmit signal normally used in 802.11b), there is the possibility of overloadingof the receiver front end. If this occurs, receiver performance will be degradedfor sometime after the event until the receiver recovers. If sensitive devicesare used in the receiver front end, protection may be required dependingon the likelihood of nearby ESD and the front end design. If the jinglingchange were held very close to the antenna, the resultant voltages wouldbe substantially greater as well.
Another interesting case is that of a mobile phone placed in a pocketor handbag with loose change. The phone would be imbedded with the ESD events!This very close range ESD could result in large signals picked up by thephone's antenna. The amplitudes may be significantly greater that those shownin Figures 2 and 3 raising the possibility of receiver front end damage. In a related, although somewhat different situation, Iknow of one case where ESD occurring within a mobile phone by static induction damaged the receiver front end and reduced the receiver sensitivity permanently by a significant amount.
Discussion of wireless LAN transmit power can be found at: http://www.wi-fiplanet.com/tutorials/article.php/1428941
A short description of a patch antenna can be seen at: http://home.iae.nl/users/plundahl/antenne/patchant.htm
Additional information on this site regarding ESD effects on systems includes:
- November 1999: Transient Suppression Plane
- May 2001, Hidden Threatsto Electronic Equipment
- June 2001, A StaticField Powered EMI Source
- January 2002, Cable Effects Part 1: CableDischarge Events
- May 2002, Printed Wiring Board Coupling toa Nearby Metal Plane, Part 2: ESD Immunity
- February 2003, Crossing Ground Plane Breaks - Part 3, Immunity to Radiated EMI
- May 2003, Signal Paths Passing Through Ground and Power Planes, Effects on Immunity
- ESD Immunity in System Designs, System FieldExperiences and Effects of PWB Layout (~950K)
- (2000 EOS/ESD Symposium paper)