
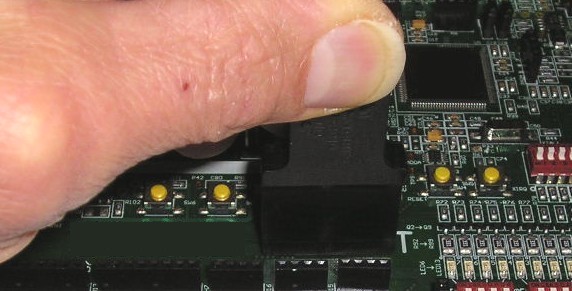
Figure 1. Measuring the Resonant Frequency of a PWB Trace
Abstract: Using a shielded
magnetic loop to measure the resonant frequencies of printed wiring
board (PWB) traces can be a useful tool in scanning a PWB for potential
problems as part of an overall evaluation of a board. A method of doing this along with an example are given.
Discussion: Most traces on a
printed wiring board should not be resonant, especially digital signals
where traces
are usually driven by resistive sources and terminated in a lossy load
in some manner. Occasionally, a trace has a sharp resonance, such
as one going to a pin header that is not connected to anything. Such
is the case shown in Figure 1. The first problem is finding resonant
traces and the second is determining if a resonance is likely to cause
a problem. This Technical Tidbit will address the first problem and
touch on the second one for traces that run (at least partially) on
surface layers and are physically accessible.
In Figure 1, a one inch square shielded magnetic loop is being held against a circuit board over a trace that goes from the flat pack IC on the upper right to the pin headers on the lower left. Loop construction is described in my 1999 IEEE EMC paper, Signal and Noise Measurement Techniques Using Magnetic Field Probes (~600K pdf file). Basically one can think of the loop as starting with a length of semi-rigid coax of small diameter and shorting the center conductor to the shield with solder at one end. Then the loop is bent around to form a square (being careful not to bend the coax too sharply at the corners) and the solder shorted end is soldered back on the coax so as to form a square symmetric loop. A small gap is made in the shield in the middle of the side opposite the feed line. An example of a very small such loop can be seen in Figure 2 without a plastic housing, such as the one used to protect the loop in Figure 1.
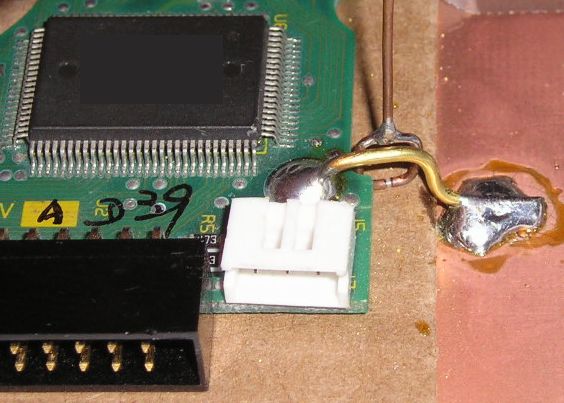
In Figure 2 the loop was being used to inject a signal into the brass wire to measure the resonant frequency of the circuit board and ground plate underneath it connected by the short brass wire. Similar to what we will be doing here, but at the system level instead of for individual traces on a circuit board.
If a square shielded loop is held next to a trace which is resonant in the frequency range being scanned, it will absorb energy from the loop and the energy reflected from the loop will be reduced at that frequency. One could either use a specctrum analyzer with a tracking generator and external directional coupler or use a network analyzer and just plot the reflection coefficient looking into the cable feeding the loop. The June 2006 Techical Tidbit, Measuring Structural Resonances describes how to optimize the measurement parameters of the instrument. For this test, a shielded loop should be used to minimize errors caused by capacitance between the loop and the structure to be measured.
The loop injects a voltage by mutual inductance (e = Mdi/dt). The resonant frequency may be dependent on the location along the trace where the voltage is injected so a location should be chosen near possible sources of excitation of the trace of interest on the board. Examples include active devices or coupling from other potentially noisy traces. One could start looking for resonances in the unpowered state. This has the advantage of not having board signals couple into the measurement but device source impedances will be different from the powered state and may result in higher Q resonances as well as affecting the measured resonant frequencies.
Figure 3 shows the result from the test in Figure 1 as a plot of return loss relative to 50 Ohms. Notice the vertical scale is only 1/2 dB/division. Since only a small amount of energy is usually coupled into the circuit from the loop, this vertical scale makes it easier to see resonances.
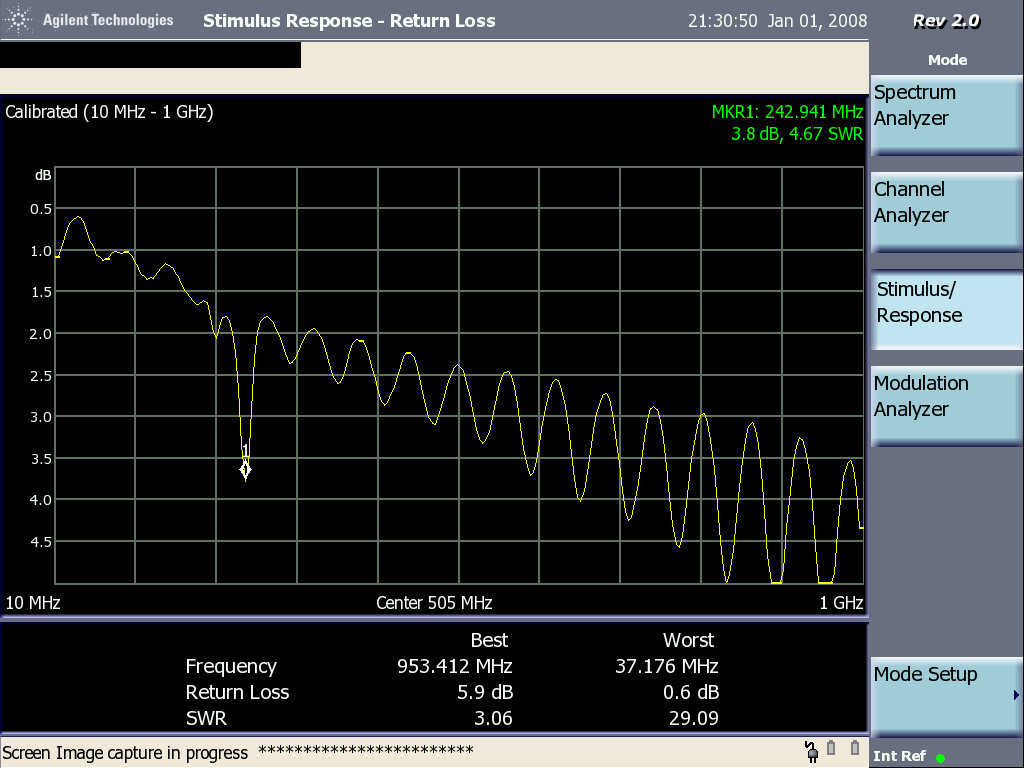
Figure 3. Wire Loop Construction
The data in Figure 3 clearly shows a resonance at about 243 MHz. Under some circumstances this could be a problem. If a source on the board with energy at 243 MHz could couple into the trace at this point, an emissions problem might occur. Also, coupled energy from outside of the board could excite this resonance and since the trace is connected to a device, might cause an immunity problem. In this example, the PWB is a two layer design with one layer being mostly a ground plane.
A resonance in a trace could also be caused by a missing termination, something one would like to find. Alternately, a trace might be used as an antenna by design, as in some wireless products. In that case, it may be possible to check the antenna's resonant frequency using this method.
Scanning a board for trace resonances can uncover design issues. After trace resonances are found one must decide if the resonance is a problem or not.
In Figure 1, a one inch square shielded magnetic loop is being held against a circuit board over a trace that goes from the flat pack IC on the upper right to the pin headers on the lower left. Loop construction is described in my 1999 IEEE EMC paper, Signal and Noise Measurement Techniques Using Magnetic Field Probes (~600K pdf file). Basically one can think of the loop as starting with a length of semi-rigid coax of small diameter and shorting the center conductor to the shield with solder at one end. Then the loop is bent around to form a square (being careful not to bend the coax too sharply at the corners) and the solder shorted end is soldered back on the coax so as to form a square symmetric loop. A small gap is made in the shield in the middle of the side opposite the feed line. An example of a very small such loop can be seen in Figure 2 without a plastic housing, such as the one used to protect the loop in Figure 1.
In Figure 2 the loop was being used to inject a signal into the brass wire to measure the resonant frequency of the circuit board and ground plate underneath it connected by the short brass wire. Similar to what we will be doing here, but at the system level instead of for individual traces on a circuit board.
Figure 2. Example of a Small Shielded Loop
If a square shielded loop is held next to a trace which is resonant in the frequency range being scanned, it will absorb energy from the loop and the energy reflected from the loop will be reduced at that frequency. One could either use a specctrum analyzer with a tracking generator and external directional coupler or use a network analyzer and just plot the reflection coefficient looking into the cable feeding the loop. The June 2006 Techical Tidbit, Measuring Structural Resonances describes how to optimize the measurement parameters of the instrument. For this test, a shielded loop should be used to minimize errors caused by capacitance between the loop and the structure to be measured.
The loop injects a voltage by mutual inductance (e = Mdi/dt). The resonant frequency may be dependent on the location along the trace where the voltage is injected so a location should be chosen near possible sources of excitation of the trace of interest on the board. Examples include active devices or coupling from other potentially noisy traces. One could start looking for resonances in the unpowered state. This has the advantage of not having board signals couple into the measurement but device source impedances will be different from the powered state and may result in higher Q resonances as well as affecting the measured resonant frequencies.
Figure 3 shows the result from the test in Figure 1 as a plot of return loss relative to 50 Ohms. Notice the vertical scale is only 1/2 dB/division. Since only a small amount of energy is usually coupled into the circuit from the loop, this vertical scale makes it easier to see resonances.
Figure 3. Wire Loop Construction
The data in Figure 3 clearly shows a resonance at about 243 MHz. Under some circumstances this could be a problem. If a source on the board with energy at 243 MHz could couple into the trace at this point, an emissions problem might occur. Also, coupled energy from outside of the board could excite this resonance and since the trace is connected to a device, might cause an immunity problem. In this example, the PWB is a two layer design with one layer being mostly a ground plane.
A resonance in a trace could also be caused by a missing termination, something one would like to find. Alternately, a trace might be used as an antenna by design, as in some wireless products. In that case, it may be possible to check the antenna's resonant frequency using this method.
Scanning a board for trace resonances can uncover design issues. After trace resonances are found one must decide if the resonance is a problem or not.
Summary: A
technique was shown for measuring the resonant frequencies of a circuit
board trace. This technique can be used to check for design errors in a
board such as a missing termination or to measure the intended response
of a design feature such as an antenna.
Additional articles on this website related to this topic are:
- Signal and Noise Measurement Techniques Using Magnetic Field Probes (~600K)
- (1999 IEEE EMC Symposium paper)
- December 2000, An Easy to Build Shielded Magnetic Loop Probe
- June 2006, Measuring Structural Resonances
- November 2007, Measuring Structural Resonances in the Time Domain - Part 1
- February 2008, Using Resonant Frequency Measurements to Extract Circuit Parameters
(Calculating the Capacitance of a BNC Barrel Adapter)
Equipment used in this Technical Tidbit:
- The spectrum analyzer used is an Agilent N1996A.
Click here for a description of my latest seminar titled:
EMC
Lab Techniques for Designers
(How to find EMC problems and have some confidence your system will pass EMC testing while it is still in your lab).
(How to find EMC problems and have some confidence your system will pass EMC testing while it is still in your lab).
 |
Check
out my podcast containing mp3 format short tutorials, tech news and
more! Just click on the
microphone to see the listing
of free
audio programs. Content is added every week on technical
topics so check back frequently. |
Home