 High Frequency MeasurementsWeb Page
Douglas C. Smith Address: P. O. Box 1457, Los Gatos,CA 95031
TEL: 800-323-3956/408-356-4186
FAX: 408-358-3799
Mobile: 408-858-4528
URL: www.dsmith.org
Email: doug@dsmith.org
Technical Tidbit - September 2003
Sin(x)/x, the Forgotten Setting - Part Two
An EMI Example
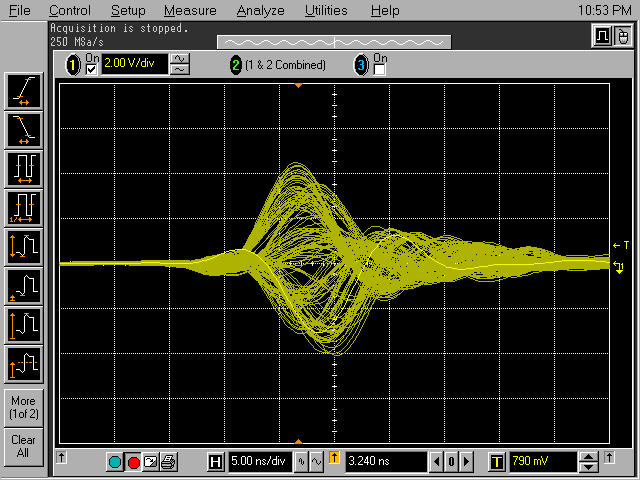
Figure 1. Accumulated Waveform Sampled at 250 MSa/sec (Sin(x)/x On)
Abstract: The August, 2003 Technical Tidbit, Sin(x)/x, the Forgotten Setting - Part One,is carried further to present an example resulting from electromagnetic interference,EMI. The example illustrates how significant error can result when use ofthe Sin(x)/x function in a digitizing scope results in hiding the possibilitythat a waveform is undersampled. The presented results are dramatic as wellas possible in real measurements. External EMI getting into a measurement is a common source of undersampling problems.
Discussion: Figure 1 shows an accumulated waveform purposely undersampledat 250 MSa/sec. Each waveform is a nice looking smooth damped sinusoid. But,because the signal is undersampled, the accumulated plot in Figure 1 showsthat the captured waveforms vary considerably from each other. If only one"glitch" were captured, it would not be apparent that this measurement is not repeatable.
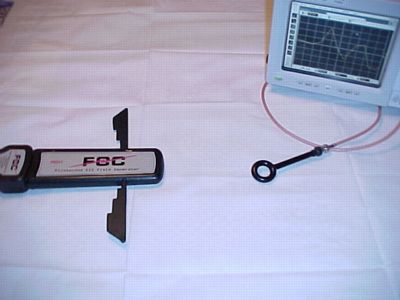
Figure 2 shows the test setup used to generate the waveforms of Figure1. A Fischer Custom Communications PEG-1 Pulsed Field ESD Simulator (click herefor 436 kB data sheet) was used to generate a series of nearly identicalimpulsive fields. These pulsed fields were picked up by a shielded magneticloop and displayed on an oscilloscope. Even though the pulses are nearlyuniform, the accumulated waveforms in Figure 1 are not due to undersampling.
Figure 2. Test Setup
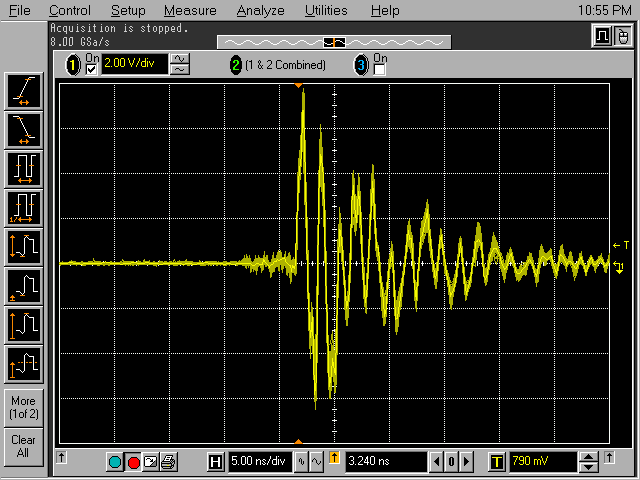
Figure 3 shows an accumulated set of waveforms generated by the sametest setup, but sampled at 8 GSa/sec. The waveforms now are nearly identicaland the resulting waveshape looks nothing like the waveforms in Figure 1even though the pulses are the same as those that generated the plots inFigure 1 and the scope settings are otherwise the same.
Figure 3. Accumulated Waveform Sampled at 8 GSa/sec
In general, we really don't know as much as we think aboutmeasured signals, because of many factors. If one knew the properties ofthe signals to measured, then the right sampling rate could be used and problemsavoided. One issue, for example, arises in that oscilloscope probesare in generalvery sensitive to external EMI, such as ESD, in the vicinity of the measurement. I have observed that normal human activity generates tens to hundreds of ESDpulses per hour in typical lab and office settings and these pulses get intomeasurements. Even in highly controlled environments where ESD is suppressed,there is still significant EMI generated by sparking contacts (light switches,motors, anything that makes a spark) and even other electronic devices likemobile phones. The pulses can have very fast risetimes, much faster than thesignals being measured. But with Sin(x)/x interpolation hiding undersamplingof these pulses, the result can look like a part of the signal being measured.That can lead to wasted time in the lab tracking down a problem that doesnot exist in the equipment.
Summary and Conclusion: Use of Sin(x)/x interpolation can hidethe fact that the sampling rate used is not fast enough to display a waveform. Because of unavoidable EMI getting into measurements, I believe Sin(x)/xinterpolation should be at least initially disabled to insure an accuratemeasurement. Once measurement accuracy is determined, Sin(x)/x can be enabledif desired but with some risk.
Other papers and articles on this site with more information relating to EMI and measurements include:
Equipment used in this article include:
Top of page
Home
Questions or suggestions? Contact me at doug@dsmith.orgCopyright © 2003 Douglas C. Smith