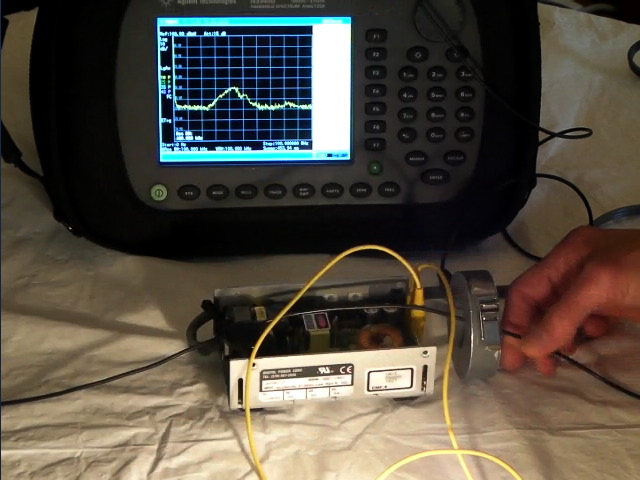
Figure 1. Test Setup For Measuring Switching Power Supply Induced Noise Current into a Nearby Wire
(Spectrum Analyzer Screen at 10 dB/div Vertically and 10 MHz/div Horizontally)
Abstract: Switched mode power
supplies can generate significant harmonics of such an amplitude as to
cause EMC emissions problems in the 30 to 100 MHz range and
occasionally at higher frequencies. Identifying switching power supply
noise is discussed as well as one coupling method that can result in
excess radiated emissions.
Discussion: Figure 1 shows the
test setup used to generate the data. The setup is composed of a
switching power supply, a (black) wire draped across the supply, an Agilent N9320B spectrum analyzer, and an
Fischer F-33-1 current probe.
The power supply is powering a 48 Watt, 12 Volt incandescent light bulb
through the yellow test leads. The black wire passing through the
F-33-1 current probe is about three meters long and its center has been
positioned over the power supply. The plot on the analyzer screen in
Figure 1 extends from zero Hz to 100 MHz at 10 MHz/div.
The noise floor on the screen of the analyzer is about 30 dBuV, a level that corresponds to enough current flowing in a one half wavelength dipole antenna to just hit the CISPR/FCC class B emissions limits in the 30 to 100 MHz frequency range. You can see the level of current near 40 MHz is about 20 dB above that level and could cause a Class B emissions problem. In reality, the power supply exhibits broad band noise, but the current in the wire peaks at the frequency at which the wire is a one half wavelength dipole. At that frequency, the driving point impedance of a dipole is near 70 Ohms, its minimum value, and the induced voltage from the power supply in the black wire is able to produce a current maximum at the center the wire.
The local field from the power supply is probably not physically large enough to radiate efficiently at 40 MHz, but once it induces enough current in the nearby black wire, the wire itself is long enough to be an efficient radiator. That is what has happened in this case.
We know that the source is the power supply for this simple case, but in some cases the source might not be so obvious. One way to discover if a broadband noise, such as shown on the analyzer screen in Figure 1, is due to a switching power supply is to adjust the analyzer as shown in Figure 2.

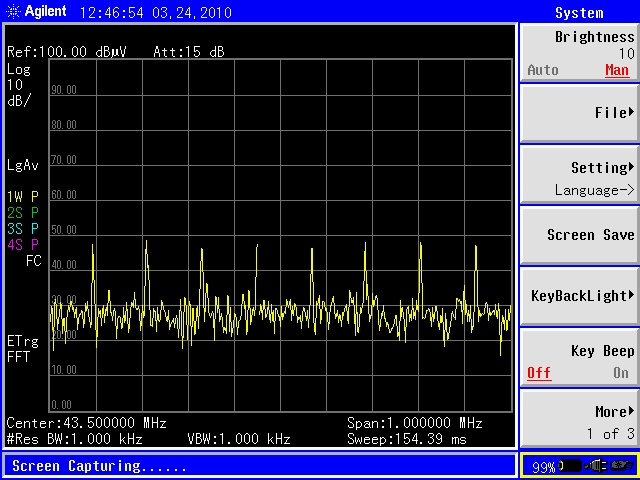
Figure 2. Spectrum Analyzer Screen Centered at 43.5 MHz with a 100 kHz/div Horixontal Scale and a Resolution Bandwidth of 1 kHz
The
analyzer has been adjusted in Figure 2 to focus the plot around a
center frequency of 43.5 MHz with a frequency span of only one MHz, 100
kHz/div. The resolution bandwidth has also been lowered from 100 kHz in
Figure 1 down to one kHz, a value consistent with the horizontal scale
of 100 kHz/div. With these analyzer parameters, you can clearly see
peaks in Figure 2 separated by about 120 kHz, the fundamental frequency
of the switching power supply used for this experiment.
Noise originating in switching power supplies that operate at a constant frequency will produce a spectrum plot similar to Figure 2, although the spacing of the harmonics may be different. That the noise is actually coming from a specific supply can be determined by holding a small loop probe near the power supply to pick up induced noise. Display the loop output on an oscilloscope or spectrum analyzer to determine the fundamental frequency. If the observed noise has a harmonic spacing the same as the fundamental switching frequency of the power supply, the supply is the likely source of the noise unless there are other supplies in the system with "the same" fundamental frequency. For the case where there are several power supplies with "the same" fundamental frequency, they are likely slightly different and this information can be used to narrow the source of the noise down to one supply out of several.
Noise originating in switching power supplies that operate at a constant frequency will produce a spectrum plot similar to Figure 2, although the spacing of the harmonics may be different. That the noise is actually coming from a specific supply can be determined by holding a small loop probe near the power supply to pick up induced noise. Display the loop output on an oscilloscope or spectrum analyzer to determine the fundamental frequency. If the observed noise has a harmonic spacing the same as the fundamental switching frequency of the power supply, the supply is the likely source of the noise unless there are other supplies in the system with "the same" fundamental frequency. For the case where there are several power supplies with "the same" fundamental frequency, they are likely slightly different and this information can be used to narrow the source of the noise down to one supply out of several.
Summary:
By expanding the spectrum plot of a broadband noise, individual
harmonics from the source of the noise can be resolved. In many cases,
the spacing of harmonics on the expanded plot will identify a switching
power supply as the source of the noise.
Additional articles on this website related to this topic are:
- Current Probes, More Useful
Than You Think (~170K)
(1998 IEEE EMC Symposium paper) - March 2006, Predicting Cable Emissions from Common Mode Current
- Agilent N9340B spectrum analyzer
- Fischer Custom Communications F-33-1 current probe
A 10+ minute video that shows
the live experiment pictured in Figure 1 and discusses implications for
system radiated emissions will be posted at http://circuitadvisor.com
in the membership section.
Need help with a design or additional training on technical subjects? Click on the image below to go to CircuitAdvisor.com, a new engineering resource for training, news, and fun.
Need help with a design or additional training on technical subjects? Click on the image below to go to CircuitAdvisor.com, a new engineering resource for training, news, and fun.
If you like the information in this article and others on this website,
much more information is available in my courses. Click here
to see a listing of upcoming courses on design, measurement, and
troubleshooting of chips, circuits, and systems. Click here to see upcoming seminars in Newport Beach, CA.
Click here for a description of my latest seminar titled (now also available online as a WebEx seminar):
EMC
Lab Techniques for Designers
(How to find EMC problems and have some confidence your system will pass EMC testing while it is still in your lab).
(How to find EMC problems and have some confidence your system will pass EMC testing while it is still in your lab).
Home

