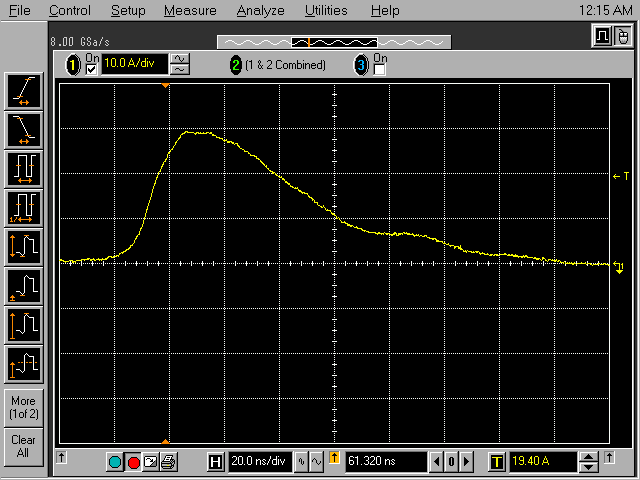
Figure 1. 15 kV Air Discharge Current Waveform from ESD Simulator - Example 1
(Vertical = 10 Amp/div, Horizontal = 20 ns/div)
Abstract: ESD testing
sometimes seems to be unrepeatable, depending of the phase of the moon
and other seemingly unrelated conditions. There are many reasons for
this, but for air discharge events, the nature of the spark in air
leads to significant variability in test results. Typical high frequency measured current
waveforms are presented for 8 kV and 15 kV air discharges and the
implications discussed.
Discussion: Figure 1 shows an example of the discharge current of a 15 kV air discharge from an EM Test ESD 30N ESD Simulator
as measured with a Fischer Custom Communications F-65 current probe.
The discharge was made by extending the test tip of the simulator
through the current probe and discharging in air to the Ground
Reference Plane of an IEC 61000-4-2 test setup. The ESD 30N is ideal
for this as the test tip extends far enough through the current probe
so the discharge reliably goes to the Ground Reference Plane instead of
the current probe body.
The discharge has a double peak reaching about 32 Amperes and an initial rise to the first peak of about 5 nanoseconds. The fall time after the second peak is approximately 100 nanoseconds, about as expected.
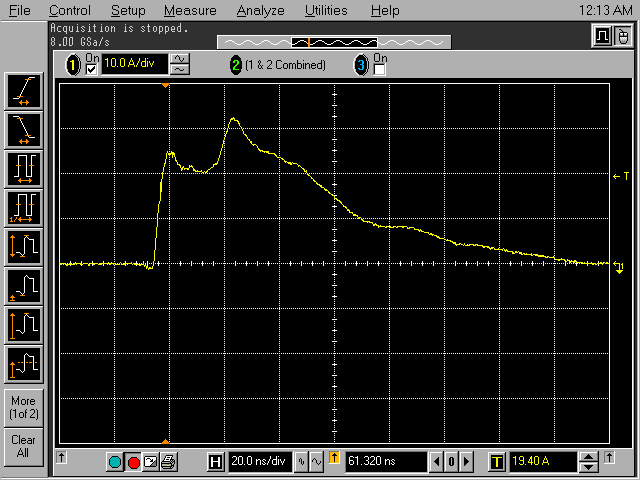
In Figure 2, the current waveform of a second air discharge at 15 kV is shown. Note there is only one peak of only about 23 Amperes and the initial rise is much slower at about 20 nanoseconds.
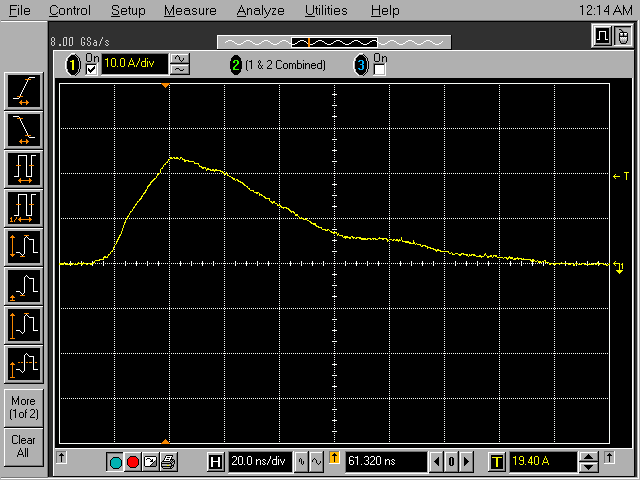
Figure 2. 15 kV Air Discharge Current Waveform from ESD Simulator - Example 2
(Vertical = 10 Amp/div, Horizontal = 20 ns/div)
Compare the waveforms in Figures 1 and 2 to Figure 3 where the risetime is about 10 nanoseconds reaching a single peak of about 29 Amperes. And Figure 4 shows yet another case of much a longer risetime of about 30 nanoseconds to a peak of about 31 Amperes. These four waveforms were selected out of a set of 15 waveforms and are typical of the rest of the set with some variations.
Figure 3. 15 kV Air Discharge Current Waveform from ESD Simulator - Example 3
(Vertical = 10 Amp/div, Horizontal = 20 ns/div)

Figure 4. 15 kV Air Discharge Current Waveform from ESD Simulator - Example 4
Figure 5 shows an example of an 8 kV air discharge. The presence of the "hash" on the waveform is due to EMI from a very fast risetime affecting the scope. The risetime is likely faster than 1 nanosecond to do this. The peak current is about 20 Amperes, not that much less than the 23 Ampere peak resulting from a 15 kV discharge in Figure 2.
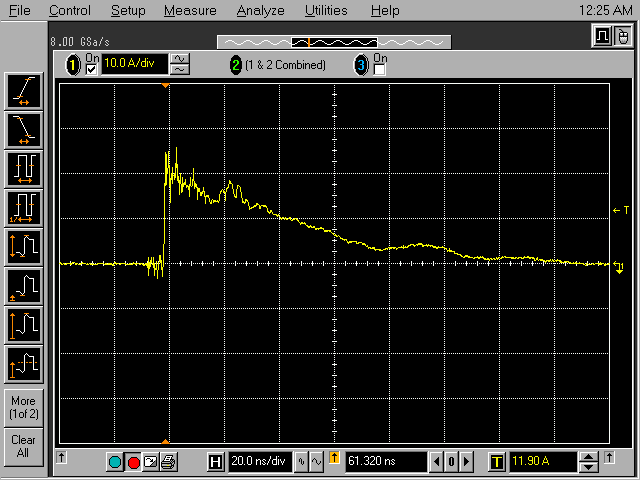
Figure 5. 8 kV Air Discharge Current Waveform from ESD Simulator - Example 1
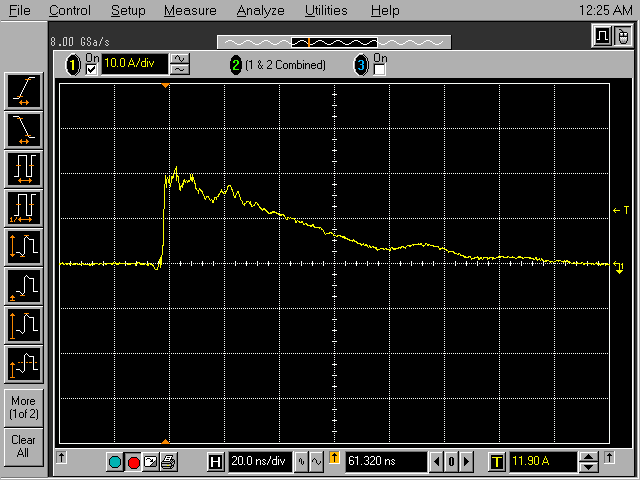
Figure 6. 8 kV Air Discharge Current Waveform from ESD Simulator - Example 2
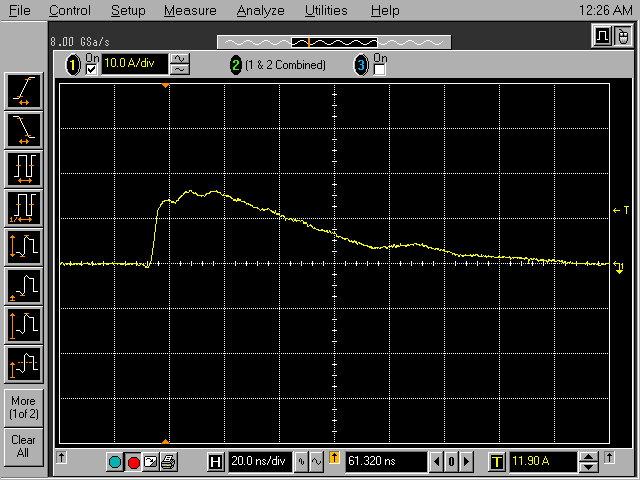
Figure 7. 8 kV Air Discharge Current Waveform from ESD Simulator - Example 3

Figure 8. 8 kV Air Discharge Current Waveform from ESD Simulator - Example 4
From the data above, it appears there is quite a bit of variation between air discharge events at 8 kV and above. A possibly oversimplified way of looking at this is that long sparks involve many collisions between electrons crossing the gap and air molecules. The electrons get scattered and are pulled in by the field with a relatively slow risetime on average with a lot of variation from spark to spark. Small, low voltage sparks result in fewer air-electron collisions and the risetime is therefore faster.
Air discharges are also subject to variation with air pressure, temperature, and humidity as well. The result is that ESD testing using discharges in air can result in a range of test results, especially at high voltages
Summary: Air
discharge testing, especially at 8 kV and above, can produce a lot of
variation in current waveforms and test results from discharge to
discharge.
The discharge has a double peak reaching about 32 Amperes and an initial rise to the first peak of about 5 nanoseconds. The fall time after the second peak is approximately 100 nanoseconds, about as expected.
In Figure 2, the current waveform of a second air discharge at 15 kV is shown. Note there is only one peak of only about 23 Amperes and the initial rise is much slower at about 20 nanoseconds.

Figure 2. 15 kV Air Discharge Current Waveform from ESD Simulator - Example 2
(Vertical = 10 Amp/div, Horizontal = 20 ns/div)
Compare the waveforms in Figures 1 and 2 to Figure 3 where the risetime is about 10 nanoseconds reaching a single peak of about 29 Amperes. And Figure 4 shows yet another case of much a longer risetime of about 30 nanoseconds to a peak of about 31 Amperes. These four waveforms were selected out of a set of 15 waveforms and are typical of the rest of the set with some variations.
Figure 3. 15 kV Air Discharge Current Waveform from ESD Simulator - Example 3
(Vertical = 10 Amp/div, Horizontal = 20 ns/div)

Figure 4. 15 kV Air Discharge Current Waveform from ESD Simulator - Example 4
(Vertical = 10 Amp/div, Horizontal = 20 ns/div)
Figure 5 shows an example of an 8 kV air discharge. The presence of the "hash" on the waveform is due to EMI from a very fast risetime affecting the scope. The risetime is likely faster than 1 nanosecond to do this. The peak current is about 20 Amperes, not that much less than the 23 Ampere peak resulting from a 15 kV discharge in Figure 2.

Figure 5. 8 kV Air Discharge Current Waveform from ESD Simulator - Example 1
(Vertical = 10 Amp/div, Horizontal = 20 ns/div)
Figure 6, also taken for an 8 kV air
discharge, is similar to Figure 5 but shows less "hash" and also a
longer risetime, about a nanosecond or two.

Figure 6. 8 kV Air Discharge Current Waveform from ESD Simulator - Example 2
(Vertical = 10 Amp/div, Horizontal = 20 ns/div)
But in Figure 7, we see a slower,
smoother waveform reaching only about 16 Amperes peak. Figure 8 has
about a 5 nanosecond initial rise with two peaks, the highest at about
15 Amperes. The area under the curve of Figure 8 is less than Figure 5,
6, or 7 so the I2t energy is less also.

Figure 7. 8 kV Air Discharge Current Waveform from ESD Simulator - Example 3
(Vertical = 10 Amp/div, Horizontal = 20 ns/div)

Figure 8. 8 kV Air Discharge Current Waveform from ESD Simulator - Example 4
(Vertical = 10 Amp/div, Horizontal = 20 ns/div)
From the data above, it appears there is quite a bit of variation between air discharge events at 8 kV and above. A possibly oversimplified way of looking at this is that long sparks involve many collisions between electrons crossing the gap and air molecules. The electrons get scattered and are pulled in by the field with a relatively slow risetime on average with a lot of variation from spark to spark. Small, low voltage sparks result in fewer air-electron collisions and the risetime is therefore faster.
Air discharges are also subject to variation with air pressure, temperature, and humidity as well. The result is that ESD testing using discharges in air can result in a range of test results, especially at high voltages
I would like to thank RMV Technology Group at NASA Ames Research Center for use of their facilities to generate the data for this Technical Tidbit.
Additional articles on this website related to this topic are:
- March 2011 Technical Tidbit, Using High Frequency Measurement of ESD Current to Find Problems With an ESD Simulator
- January 2011, Using Averaging to Cleanup Scope Waveforms
- December 2010 Technical Tidbit, Comparing "IEC 61000-4-2 Compliant" ESD Simulators
- November 2010, Comparison of Current Waveforms from 150 Ohm and 330 Ohm Networks in an IEC 61000-4-2 Simulator
- September 2004, Mobile Phone Response to EMI from Small Metal ESD
- Fischer Custom Communications F-65 Current Probe
- Agilent Infinium 54845a scope
- EM Test ESD 30N ESD Simulator
I would like to thank RMV Technology Group at NASA Ames Research Park for the use of their facilities to perform the tests for this article.
Need help with a design or additional training on technical subjects? Click on the image below to go to CircuitAdvisor.com, a new engineering resource for training, news, and fun.
Need help with a design or additional training on technical subjects? Click on the image below to go to CircuitAdvisor.com, a new engineering resource for training, news, and fun.
If you like the information in this article and others on this website,
much more information is available in my courses. Click here
to see a listing of upcoming courses on design, measurement, and
troubleshooting of chips, circuits, and systems. Click here to see upcoming seminars in Newport Beach, CA.
Click here for a description of my latest seminar titled (now also available online as a WebEx seminar):
EMC
Lab Techniques for Designers
(How to find EMC problems and have some confidence your system will pass EMC testing while it is still in your lab).
(How to find EMC problems and have some confidence your system will pass EMC testing while it is still in your lab).
Home

