
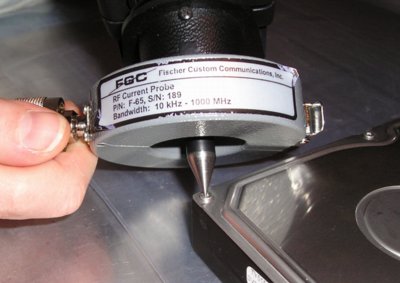
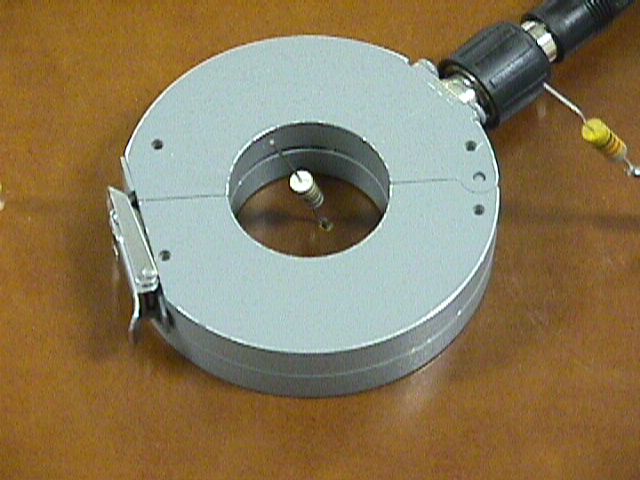
Figure 1. Using A Current Probe to Characterize an ESD Test
Abstract: It is imperative that test
variables be controlled to avoid testing errors when looking for design
problems or during compliance tests. Making measurements to characterize
the test setup is one way to accomplish this. Using an ESD
example, the use of current probes during testing is demonstrated as a
way to monitor and control variables in the ESD test setup and equipment.
Discussion: The importance of controlling variables during tests that involve high frequencies, such as ESD, cannot be overstated. An example of ESD testing is used in this article to illustrate the point. Figure 1 above shows a current probe being used for this purpose. By measuring the injected ESD current, uncontrolled variables in the test can be exposed and corrected.
Since ESD, either simulated or real, is a wide bandwidth event with the high end of the frequency spectrum often extending into hundreds or thousands of megahertz, small parasitic capacitances and inductances can have significant effects. If these stray impedances vary during the test, the results of the test may be difficult to reproduce.
In Figure 1, ESD is being applied to a disk drive through a Fischer F-65 current probe. Seemingly small changes to the test setup can result in a large differences to the ESD current delivered to the drive. For instance, if the insulation (visible in Figure 1) between the drive and the metal horizontal coupling plane (metal tabletop) used in the test differs in thickness from test to test, the capacitance of the drive to the metal plane will vary as well. The variation will be approximately in inverse proportion to the thickness as the drive and plane form a parallel plate capacitor. This results in significant differences in the current applied to the drive for different insulation thickness. I have seen variations of more than two to one in ESD current because attention was not paid to the parameters of the insulation on the horizontal coupling plane. IEC 61000-4-2 calls for a thickness of 0.5 mm, and yet I have seen insulation thickness used that was many times this figure. I have even seen thick ESD static dissipative mats used for the purpose. For many reasons, ESD mats should never be used this way in ESD testing.
If an air discharge is made to the EUT (equipment under test) from a piece of metal that is plated, the plating material will also significantly change the current delivered to the EUT. In actual lab tests, I have observed differences of nearly ten to one in the ESD current due to this effect. The sharpness of the edge of the metal also affects the voltage breakdown in air and therefore the discharge current. All of these effects can be easily seen and corrected by monitoring the ESD current as shown in Figure 1. Be sure to keep the probe spaced far enough from the target equipment so that the probe itself is not subjected to ESD testing. In Figure 1, the probe is getting a little close to the disk drive for comfort.
Once the test is stable and the desired ESD current is well controlled, it is not necessary to monitor the current on every discharge. It is a good idea to remeasure a previous discharge periodically to make sure everything is still working, especially at the beginning of a test that has been continued after a break.
After test variables are controlled through measurements, the ESD current waveform delivered into a piece of equipment by an ESD simulator can still vary significantly from the waveform specified in IEC 61000-4-2. Knowing the actual waveform can help one troubleshoot problems as well as understand test results. Measuring the actual ESD current waveform and making sure variations are kept to a minimum has real benefits.
Consider Figure 2 which shows the suggested waveshape of an IEC 61000-4-2 ESD simulator when the simulator is discharged into a measurement test setup specified in the standard. The specification calls out the initial risetime, the first current peak and the value of current at 30 and 60 nanoseconds, but the picture in Figure 2 suggests what the actual current waveform should look like.
Figure 2. Suggested IEC 61000-4-2 Waveform
The actual ESD current that results when a simulator is applied to real equipment can be quite different. Figure 3 shows a test setup where ESD is applied either directly or through a multi-turn ferrite core to the chassis of a piece ot electronic equipment. This test was described in last month's Technical Tidbit for September 2005, "Multiple Turn and Single-turn Ferrite Chokes Compared,"
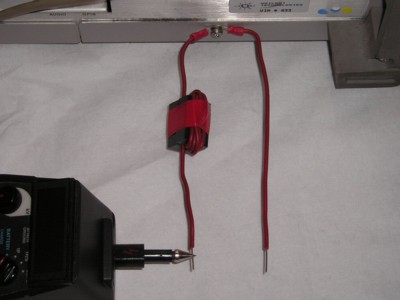
Figure 3. Measurement of ESD Current into Chassis with Multi-Turn Ferrite
The resulting ESD current waveform for both connections in Figure 3 are shown in Figures 4 and 5. The simulator as used in this configuration has a risetime faster than what IEC 61000-4-2 calls for, but on the time scales of Figures 4 and 5, the difference would be difficult to see.
In Figure 4 there is a double peak and more pronounced dip after the peaks than in Figure 2. Figure 5 bears little resemblance to the IEC waveform.
Figure 5. ESD Current into Chassis Through Multi-Turn Ferrite
Figures 6 and 7 show a test setup for measuring ESD current through a small inductor connected to a ground plane (chassis) and the resulting current. This test configuration is described in the May 2000 Technical Tidbit, Measuring Inductor Performance. The ESD current through the small 10 microhenry inductor shown in Figure 7 again varies substantially from the IEC waveform.
V = 0.5 Amp/div H = 10 ns/div
Figure 7. ESD Current Waveform Through Inductor of Figure 6
The point to be made is that the ESD current varies dramatically with the specific equipment being tested. Knowing what the ESD current waveform is can help one understand the test results as well as fix any problems the test uncovers. The May 2000 Technical Tidbit showed that inductors don't always behave as we would expect under ESD conditions.
Summary: Controlling test variables in tests involving high frequency signals is imperative. Measurements should be made to verify test consistency. The example of ESD discussed showed clearly for several cases the value in using measurements to verify test procedures and in understanding test results.
Discussion: The importance of controlling variables during tests that involve high frequencies, such as ESD, cannot be overstated. An example of ESD testing is used in this article to illustrate the point. Figure 1 above shows a current probe being used for this purpose. By measuring the injected ESD current, uncontrolled variables in the test can be exposed and corrected.
Since ESD, either simulated or real, is a wide bandwidth event with the high end of the frequency spectrum often extending into hundreds or thousands of megahertz, small parasitic capacitances and inductances can have significant effects. If these stray impedances vary during the test, the results of the test may be difficult to reproduce.
In Figure 1, ESD is being applied to a disk drive through a Fischer F-65 current probe. Seemingly small changes to the test setup can result in a large differences to the ESD current delivered to the drive. For instance, if the insulation (visible in Figure 1) between the drive and the metal horizontal coupling plane (metal tabletop) used in the test differs in thickness from test to test, the capacitance of the drive to the metal plane will vary as well. The variation will be approximately in inverse proportion to the thickness as the drive and plane form a parallel plate capacitor. This results in significant differences in the current applied to the drive for different insulation thickness. I have seen variations of more than two to one in ESD current because attention was not paid to the parameters of the insulation on the horizontal coupling plane. IEC 61000-4-2 calls for a thickness of 0.5 mm, and yet I have seen insulation thickness used that was many times this figure. I have even seen thick ESD static dissipative mats used for the purpose. For many reasons, ESD mats should never be used this way in ESD testing.
If an air discharge is made to the EUT (equipment under test) from a piece of metal that is plated, the plating material will also significantly change the current delivered to the EUT. In actual lab tests, I have observed differences of nearly ten to one in the ESD current due to this effect. The sharpness of the edge of the metal also affects the voltage breakdown in air and therefore the discharge current. All of these effects can be easily seen and corrected by monitoring the ESD current as shown in Figure 1. Be sure to keep the probe spaced far enough from the target equipment so that the probe itself is not subjected to ESD testing. In Figure 1, the probe is getting a little close to the disk drive for comfort.
Once the test is stable and the desired ESD current is well controlled, it is not necessary to monitor the current on every discharge. It is a good idea to remeasure a previous discharge periodically to make sure everything is still working, especially at the beginning of a test that has been continued after a break.
After test variables are controlled through measurements, the ESD current waveform delivered into a piece of equipment by an ESD simulator can still vary significantly from the waveform specified in IEC 61000-4-2. Knowing the actual waveform can help one troubleshoot problems as well as understand test results. Measuring the actual ESD current waveform and making sure variations are kept to a minimum has real benefits.
Consider Figure 2 which shows the suggested waveshape of an IEC 61000-4-2 ESD simulator when the simulator is discharged into a measurement test setup specified in the standard. The specification calls out the initial risetime, the first current peak and the value of current at 30 and 60 nanoseconds, but the picture in Figure 2 suggests what the actual current waveform should look like.
Figure 2. Suggested IEC 61000-4-2 Waveform
The actual ESD current that results when a simulator is applied to real equipment can be quite different. Figure 3 shows a test setup where ESD is applied either directly or through a multi-turn ferrite core to the chassis of a piece ot electronic equipment. This test was described in last month's Technical Tidbit for September 2005, "Multiple Turn and Single-turn Ferrite Chokes Compared,"
Figure 3. Measurement of ESD Current into Chassis with Multi-Turn Ferrite
The resulting ESD current waveform for both connections in Figure 3 are shown in Figures 4 and 5. The simulator as used in this configuration has a risetime faster than what IEC 61000-4-2 calls for, but on the time scales of Figures 4 and 5, the difference would be difficult to see.
In Figure 4 there is a double peak and more pronounced dip after the peaks than in Figure 2. Figure 5 bears little resemblance to the IEC waveform.
Figure 4. ESD Current Resulting from Figure 2 Setup
(Vertical scale = 500 mA/division)
(Vertical scale = 500 mA/division)
Figure 5. ESD Current into Chassis Through Multi-Turn Ferrite
Figures 6 and 7 show a test setup for measuring ESD current through a small inductor connected to a ground plane (chassis) and the resulting current. This test configuration is described in the May 2000 Technical Tidbit, Measuring Inductor Performance. The ESD current through the small 10 microhenry inductor shown in Figure 7 again varies substantially from the IEC waveform.
Figure 6. Setup for Measuring ESD Current into Inductors Connected to a Chassis
V = 0.5 Amp/div H = 10 ns/div
Figure 7. ESD Current Waveform Through Inductor of Figure 6
The point to be made is that the ESD current varies dramatically with the specific equipment being tested. Knowing what the ESD current waveform is can help one understand the test results as well as fix any problems the test uncovers. The May 2000 Technical Tidbit showed that inductors don't always behave as we would expect under ESD conditions.
Summary: Controlling test variables in tests involving high frequency signals is imperative. Measurements should be made to verify test consistency. The example of ESD discussed showed clearly for several cases the value in using measurements to verify test procedures and in understanding test results.
Other articles on this website related to this topic are:
- May 2000, Measuring Inductor Performance
- June 2004, Misapplication of Test Standards
- May 2005, Verifying Current Measurements - Revisited
- September 2005, Multiple Turn and Single-turn Ferrite Chokes Compared
If you like the information in this article and others on this website, much more information is available in my courses. Click here to see a listing of upcoming courses on design, measurement, and troubleshooting of chips, circuits, and systems.
Available now for private on-site delivery and as a public seminar: my new one day seminar titled: Failure Analysis and Prevention in Electronic Circuits (Design Troubleshooting for the Lab and Field).
Equipment used in this article includes:
Top of page
Home